In our digital subway city, some stations are “Hubs.” They sit right in the middle, and every train line passes through them. In data engineering, if you don’t organize your stations, your subway maps will look like a plate of spaghetti.
To keep things clean, we use Dimensional Modeling. The most famous layout for speed is the Star Schema.
What is a Star Schema?
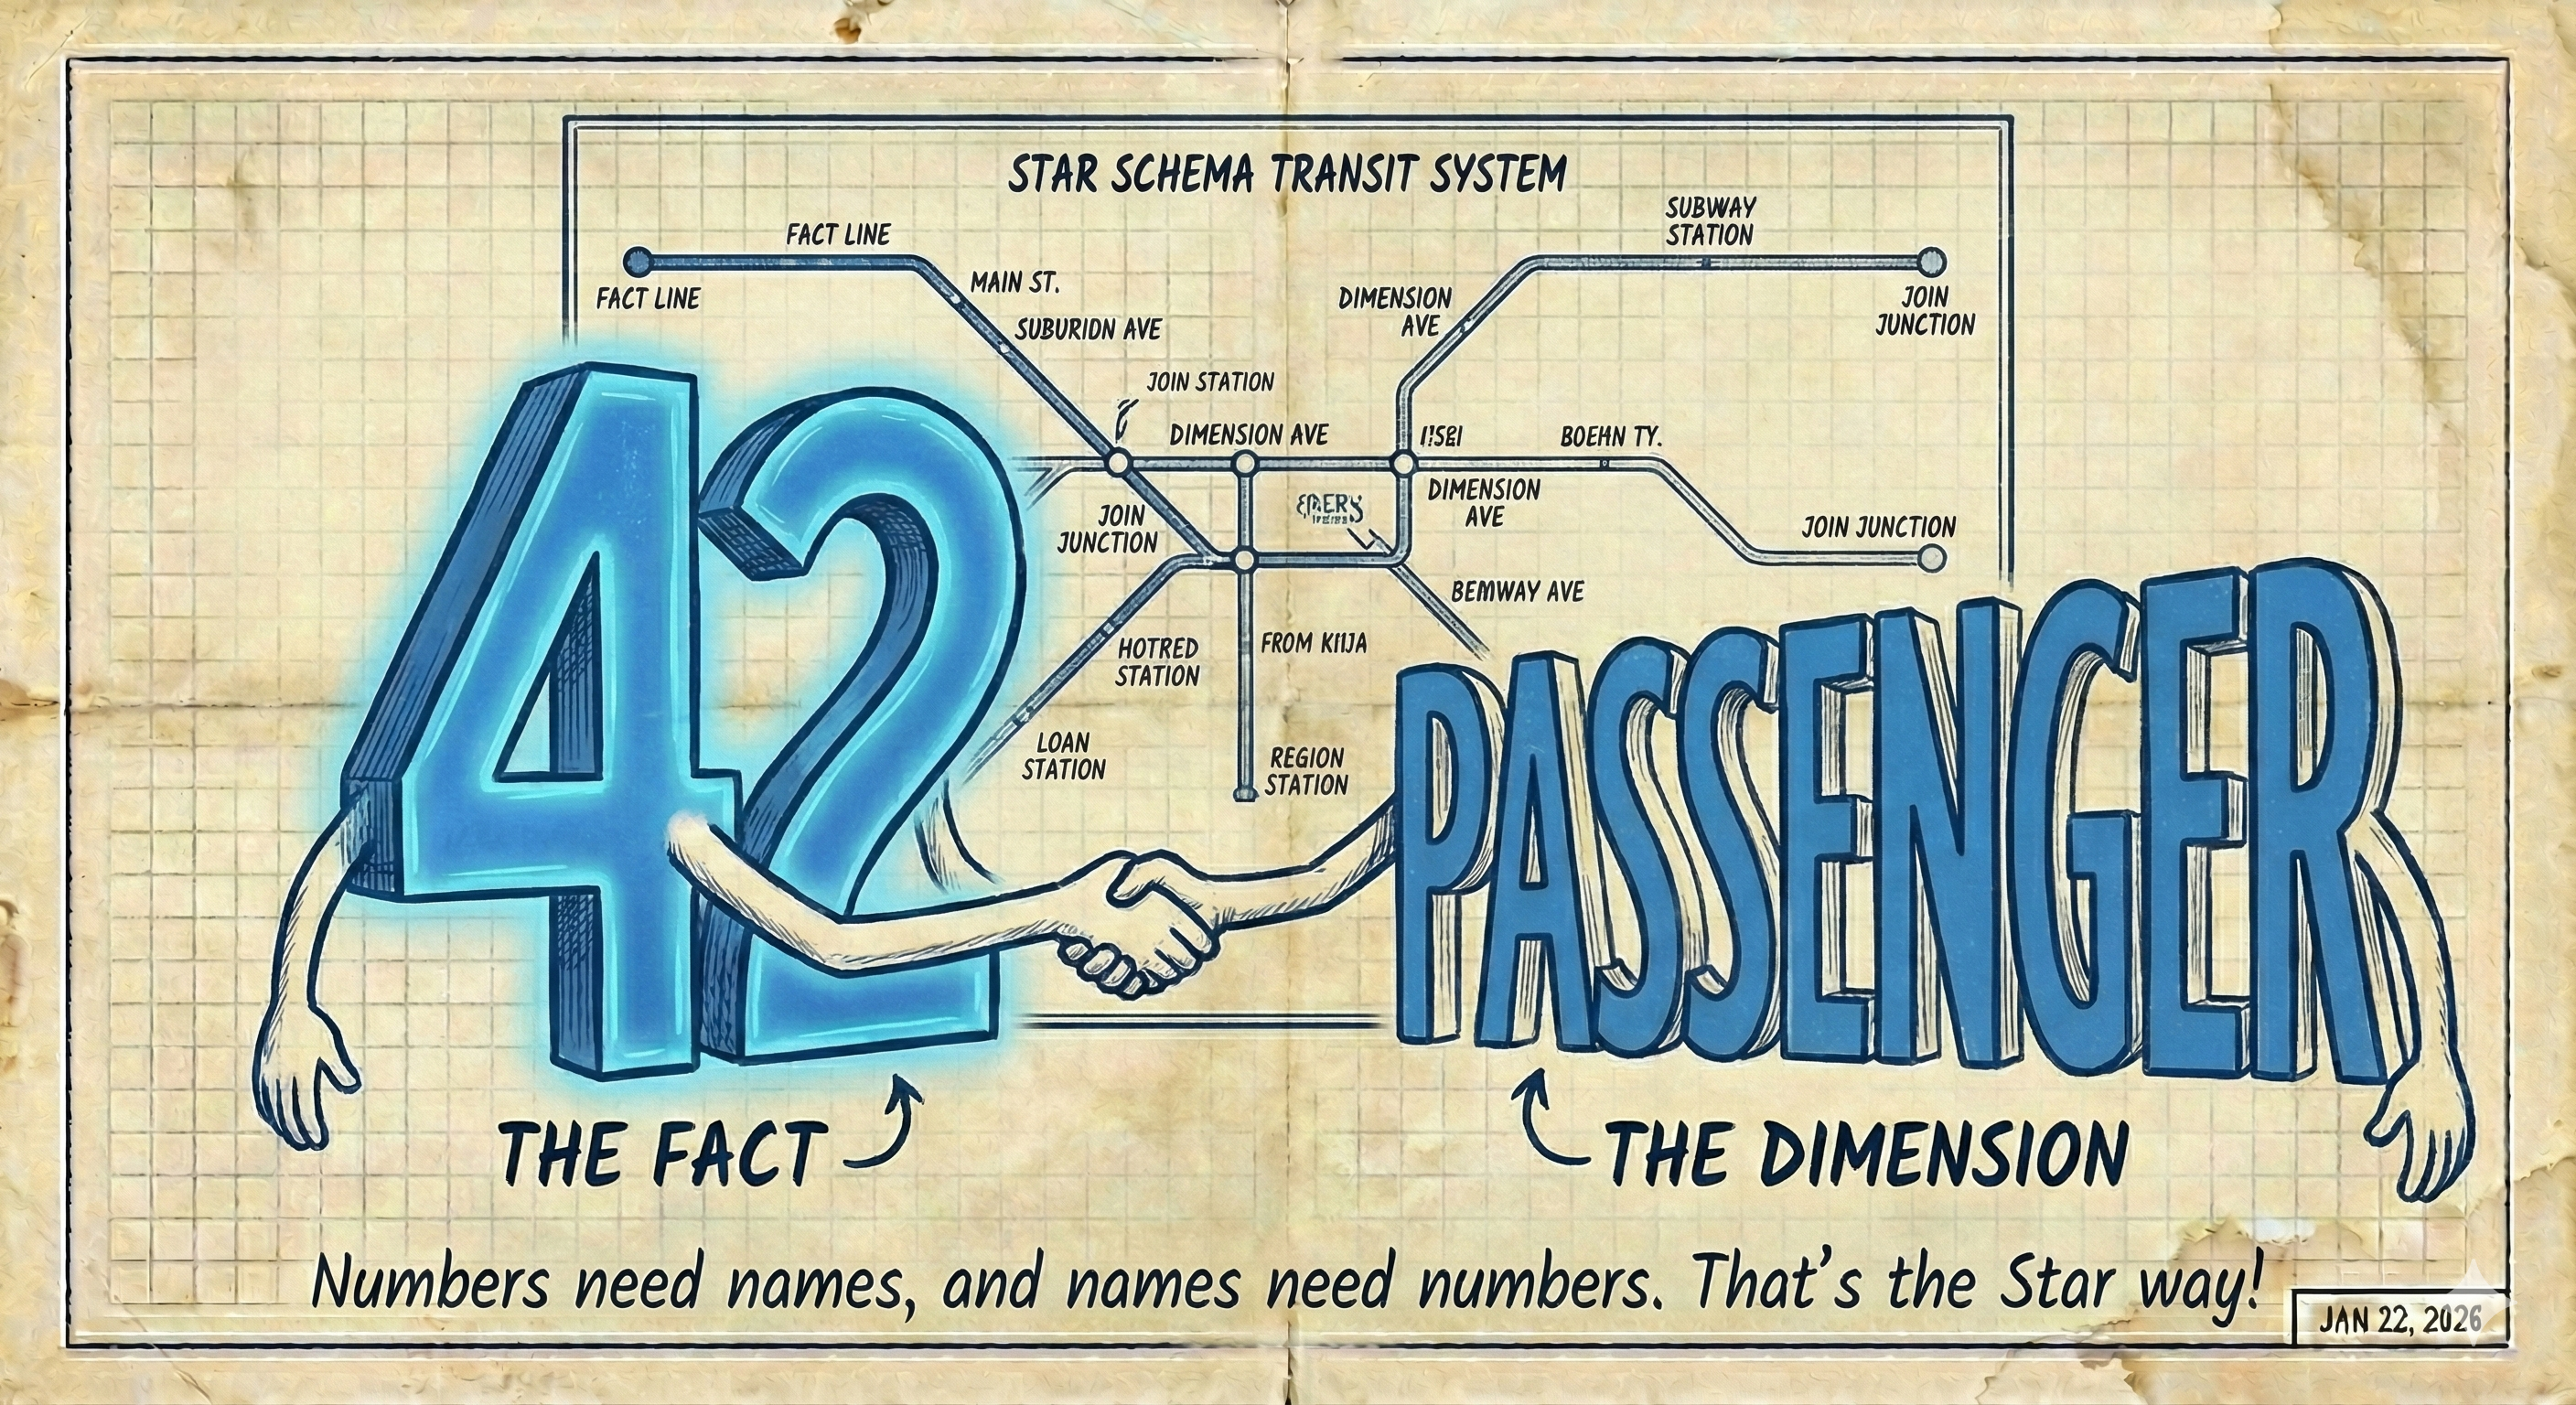
The Star Schema is designed for one thing: Speed. It organizes your data into two distinct types of citizens: Facts and Dimensions.
- The Center (The Fact Table): This is the heart of the action.
- The Points (The Dimension Tables): These are the storytellers that provide context.
It’s called a “Star” because the Fact table is the sun in the middle, and the Dimensions are the rays shining out.
1. The Fact Table: “The Heart of the Action”
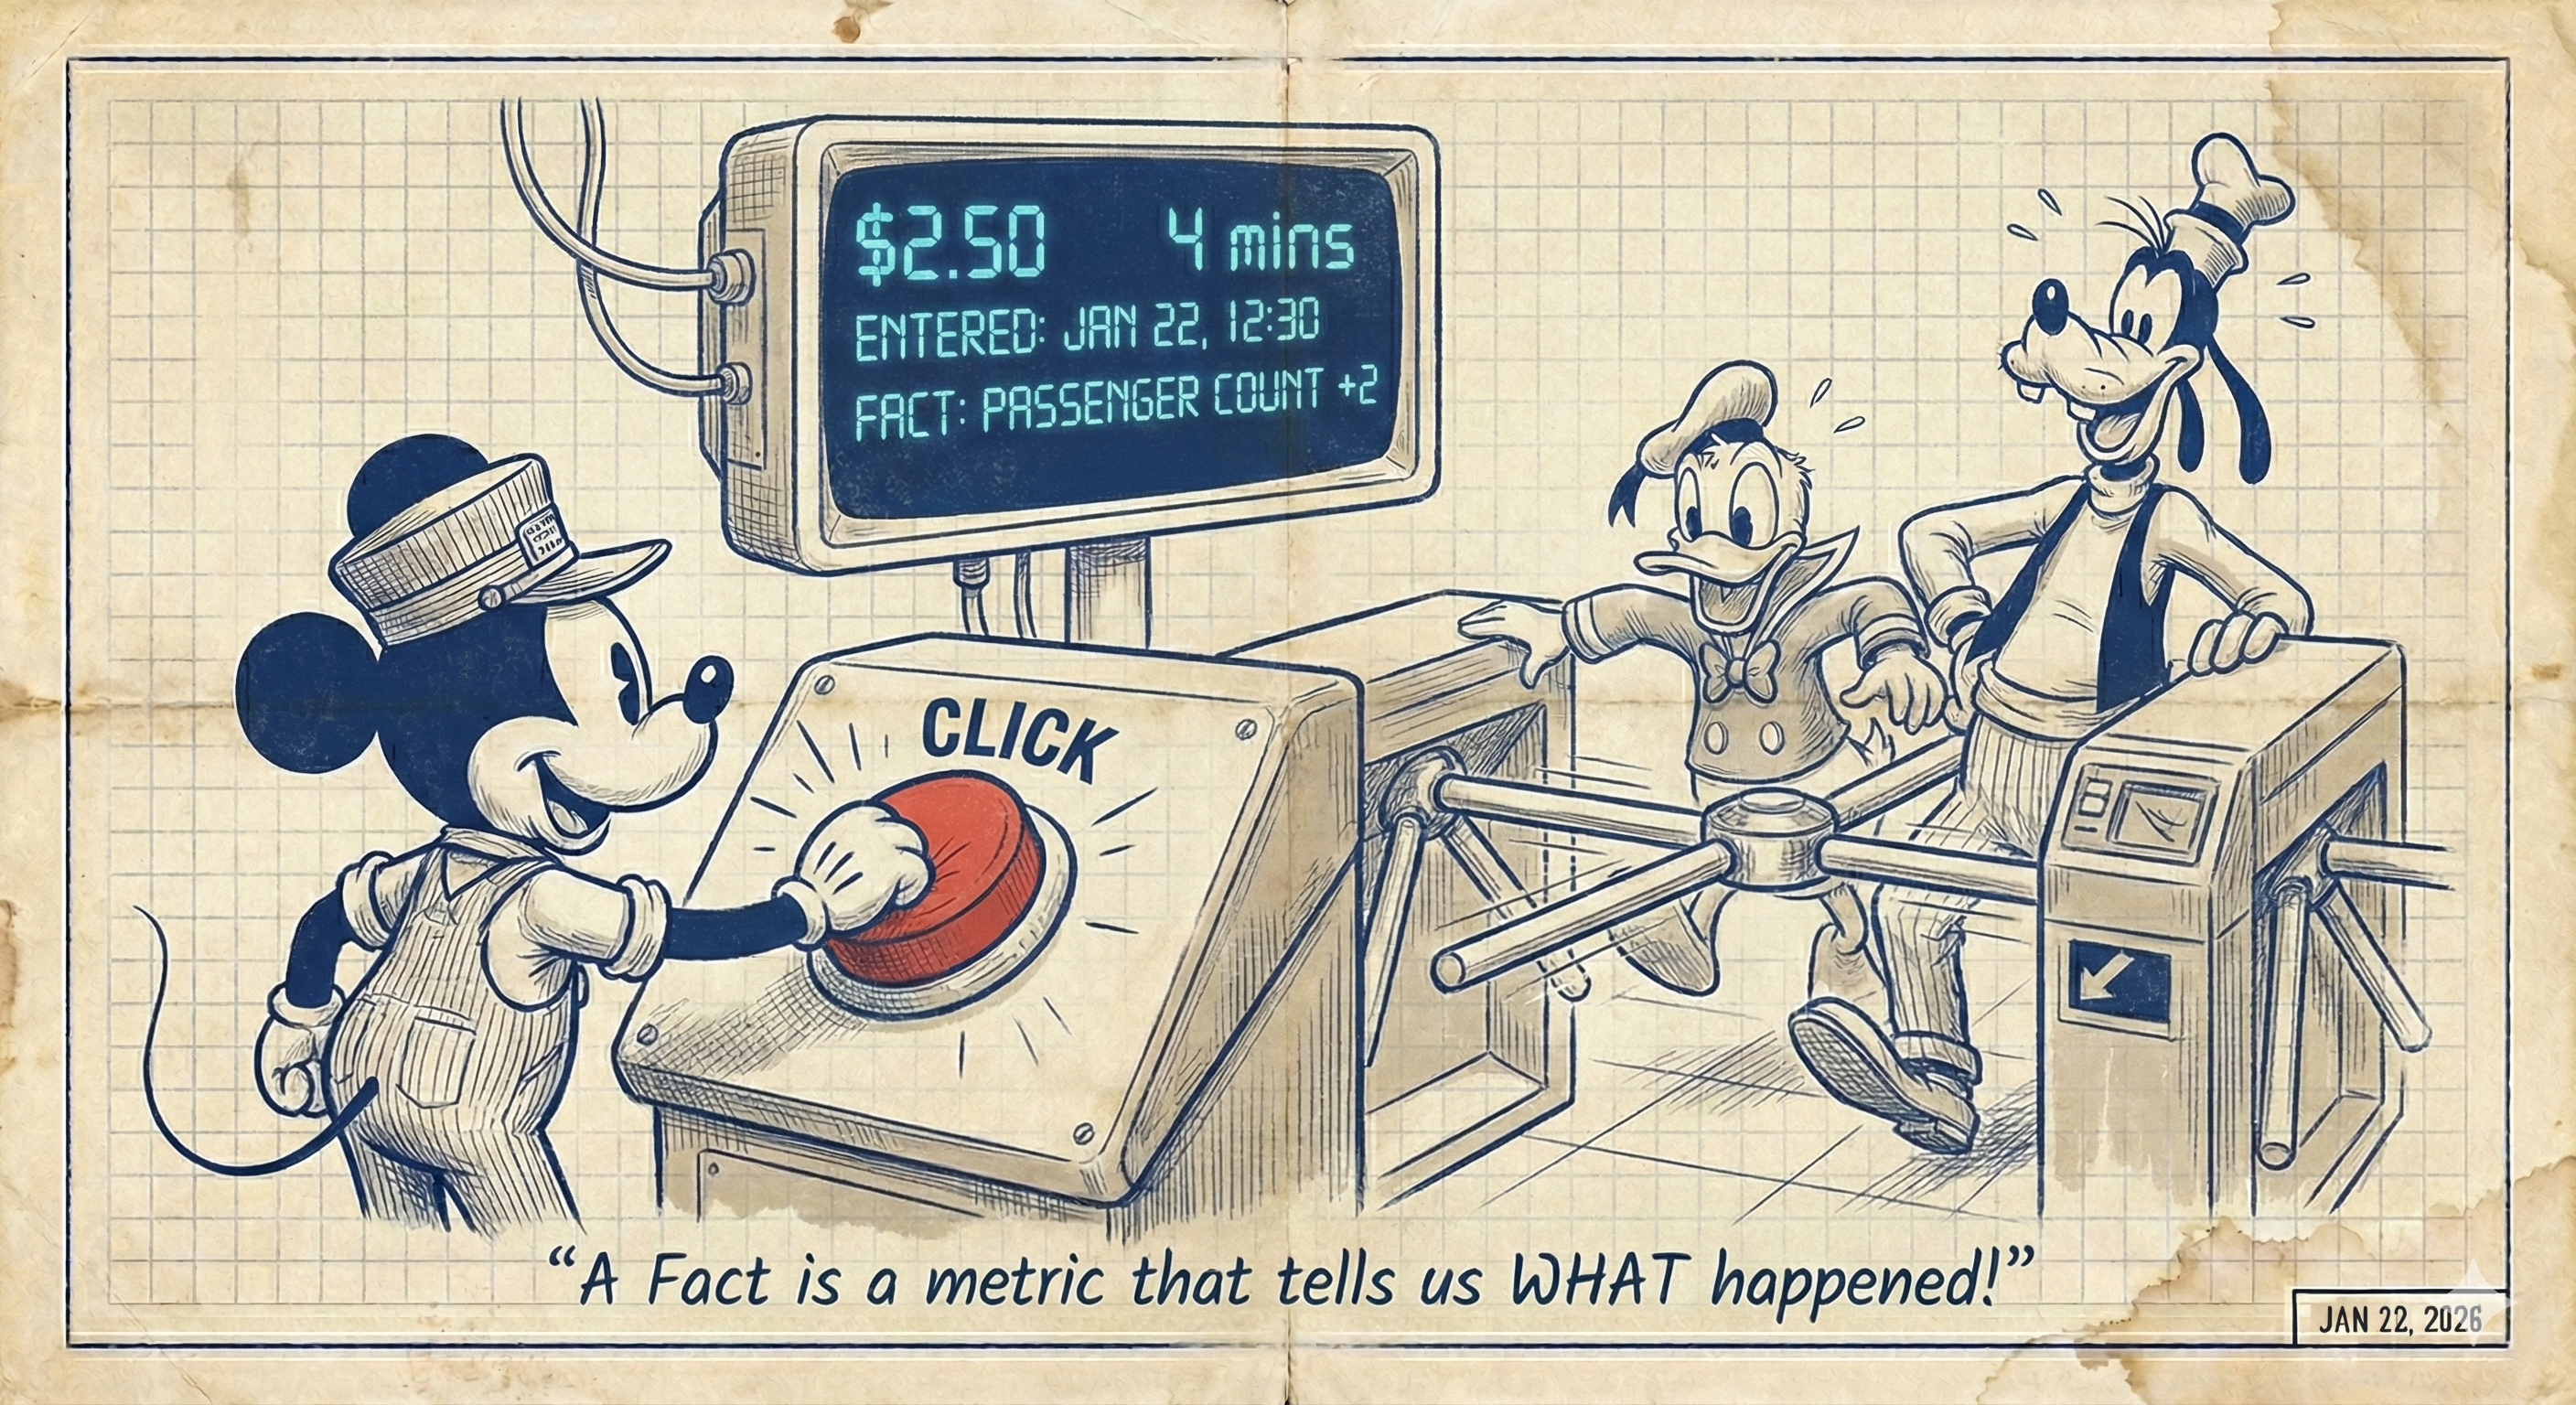
The Fact Table is a record of a specific event that happened at a specific moment in time. Think of it as the Subway Turnstile. Every time someone walks through, the turnstile clicks and records a “Fact.”
Characteristics of a Fact:
- Quantitative: It answers “How much?” or “How many?” (Numbers!).
- Foreign Keys: It contains “ID” numbers that act as secret tunnels leading to the Dimension tables.
📝 Example: Fact_Ticket_Sales
| Ticket_ID | Date_ID | Station_ID | Passenger_ID | Price (Metric) | Wait_Time (Metric) |
|---|---|---|---|---|---|
| 5001 | 20260122 | 10 | 99 | $2.50 | 4 mins |
| 5002 | 20260122 | 12 | 45 | $5.00 | 12 mins |
2. The Dimension Table: “The Storytellers”
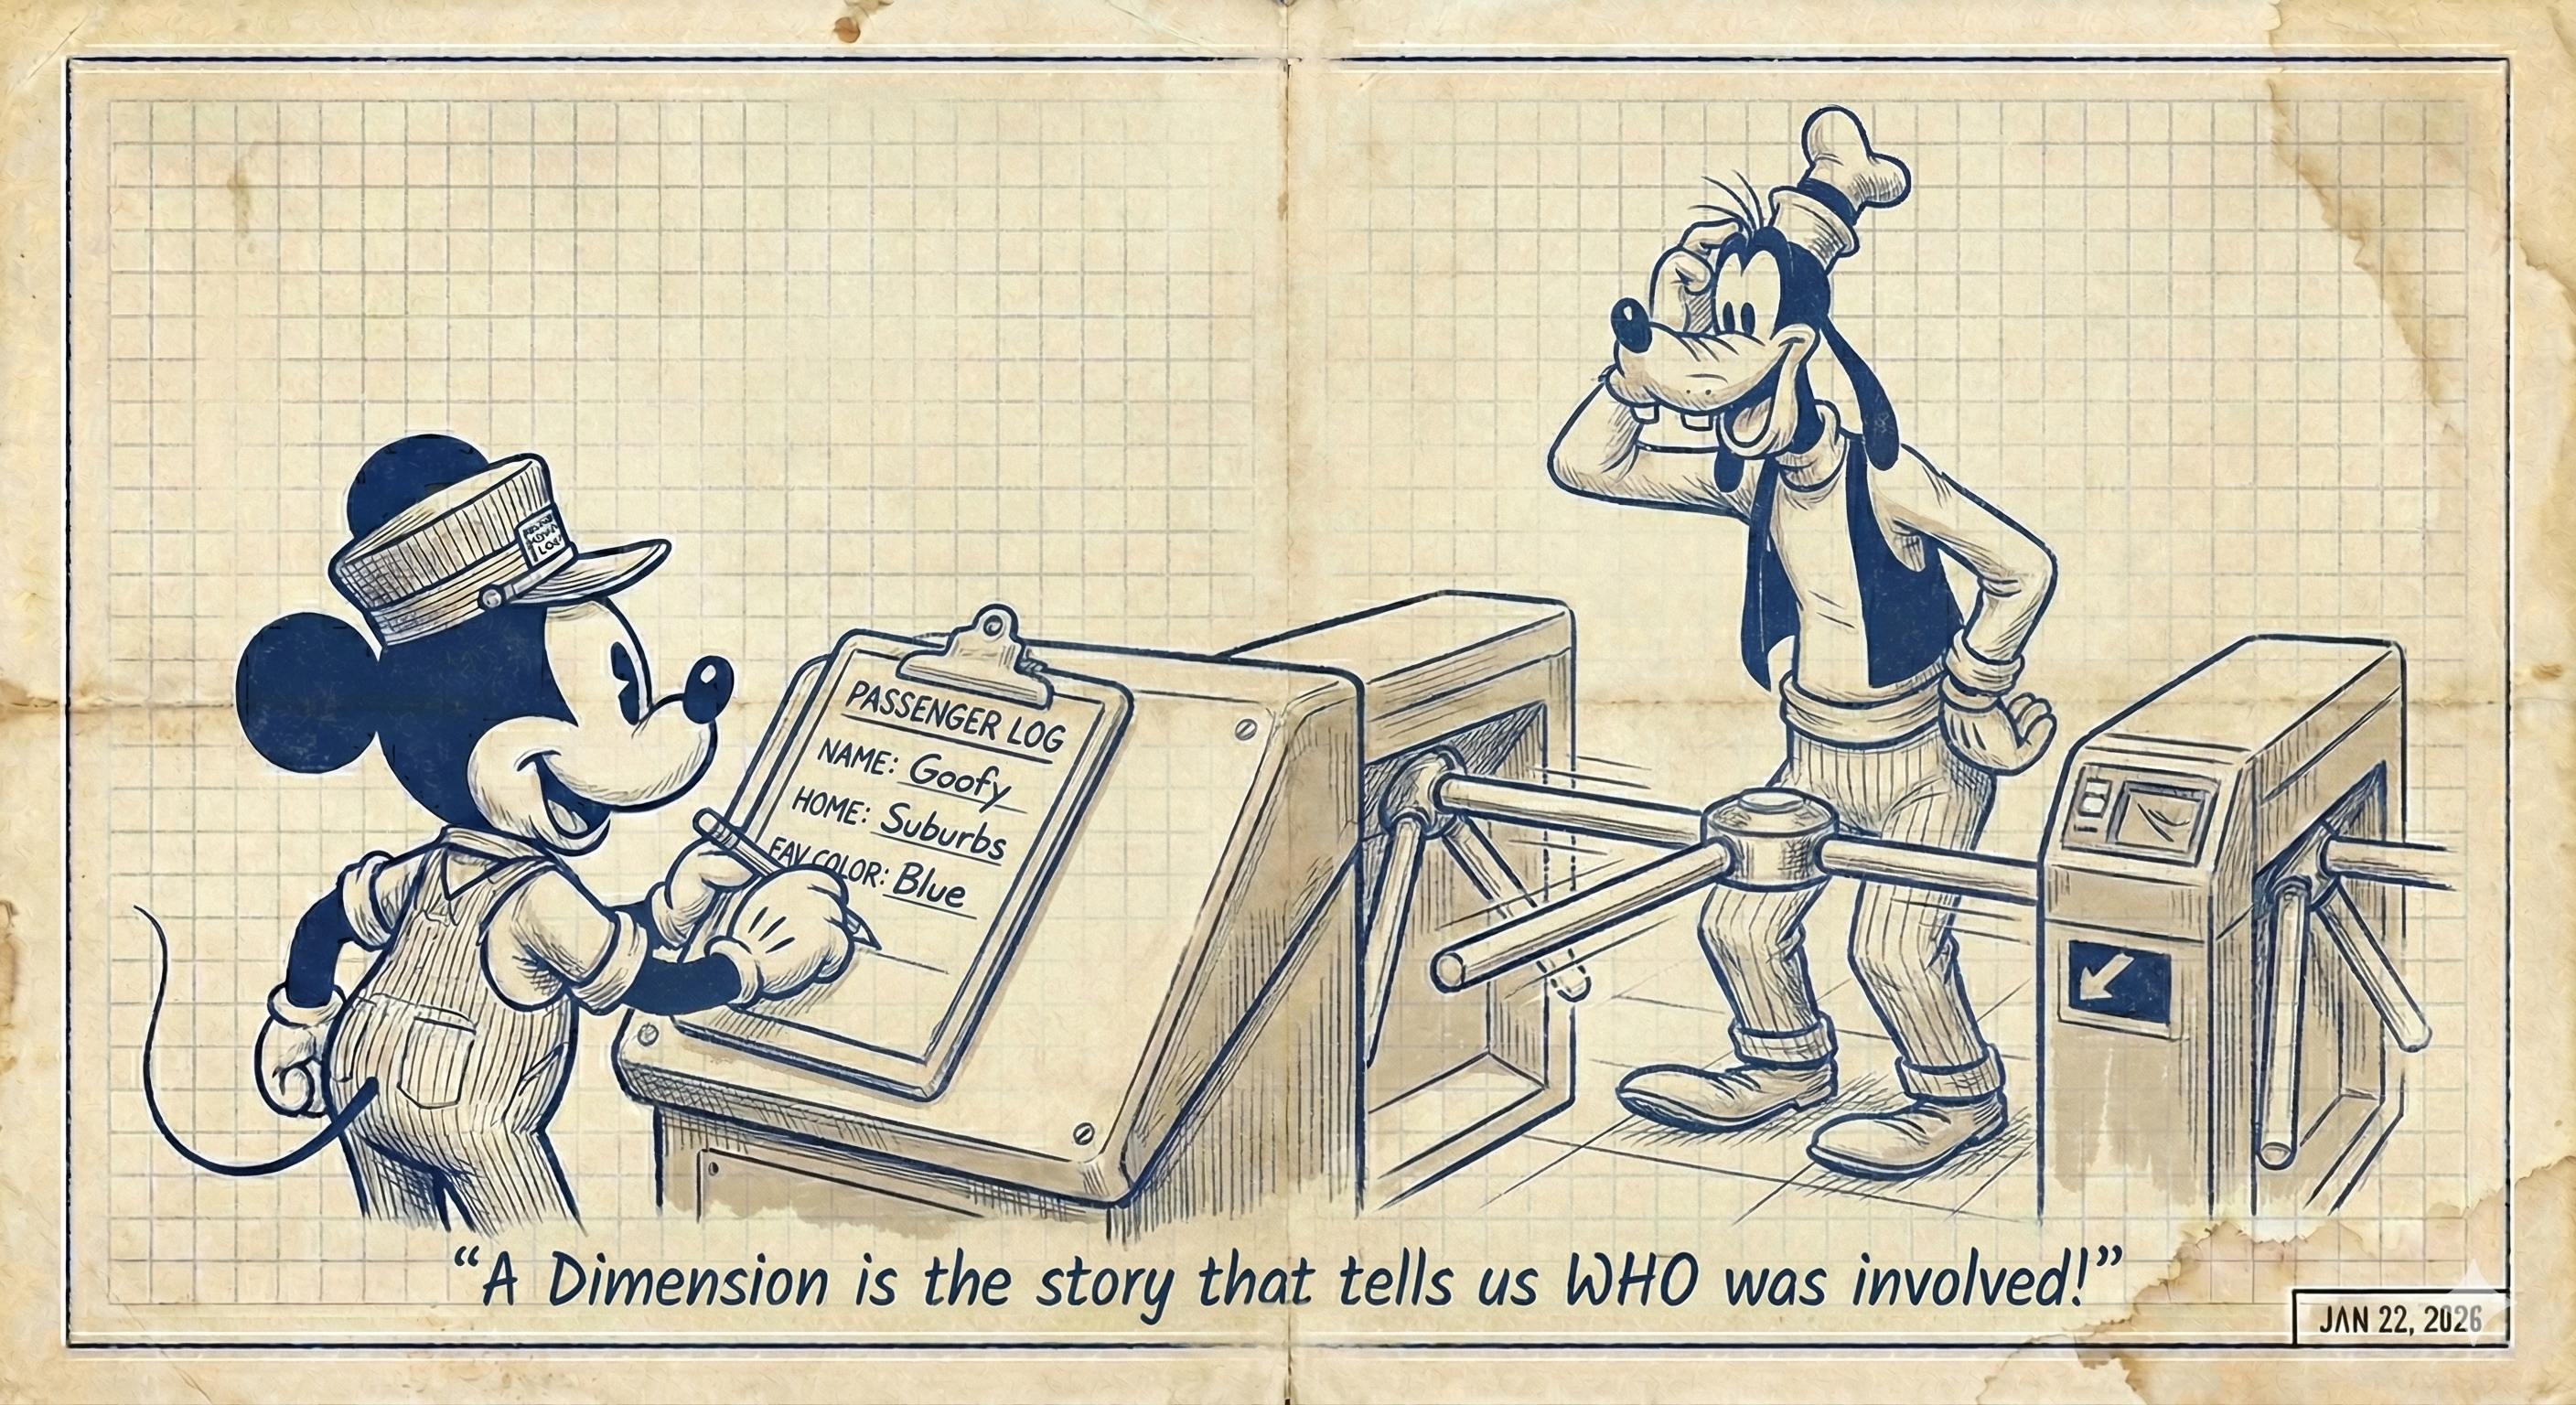
The Dimension Tables provide the context. They answer the “Who,” “Where,” “When,” and “Why.” If the Fact is the “Click” of the turnstile, the Dimensions are the descriptions of the people walking through it.
Characteristics of a Dimension:
- Qualitative: It contains descriptive text (Names, Cities, Colors).
- Filtering: This is how you “Slice” your data (e.g., “Show me sales by District”).
📝 Example: Dim_Station
| Station_ID | Station_Name | Line_Color | District | Has_Elevator |
|---|---|---|---|---|
| 10 | Mickey Central | Red | Downtown | Yes |
| 12 | Goofy Gardens | Blue | Suburbs | No |
3. Why Mickey Chose the “Express” Line
The Story: Mickey needs to know: “How much money did we make from Blue Line passengers in the Suburbs?”
In a Star Schema, Mickey starts at the center (Fact). He makes one single jump to the Station table to find “Suburbs” and “Blue.” Because there is only one “hop” between the numbers and the names, the Data Train arrives at the answer almost instantly.
| Feature | Fact Table (The Action) | Dimension Table (The Story) |
|---|---|---|
| Data Type | Numbers (Price, Quantity) | Text (Name, City, Color) |
| Size | Long and Skinny (Millions of rows) | Short and Wide (Many descriptions) |
| Purpose | To be Summed or Averaged | To Filter, Group, or Label |
What’s next?
Now that we’ve mastered the simple Star, we need to look at what happens when the city gets too complex. Is the Star always enough, or do we need to build “Snowflakes” in the suburbs?