If you walk through a bustling city like New York, Tokyo, or London, you see the lights, the shops, and the skyscrapers. That is the Front-end. If you look at the people making big decisions in boardrooms based on colorful charts, that is Data Analytics.
But beneath their feet, there is a second city. A city of tunnels, high-voltage cables, and steel tracks. Thousands of people are moving through the dark at 60 miles per hour so that the “visible” city can function.
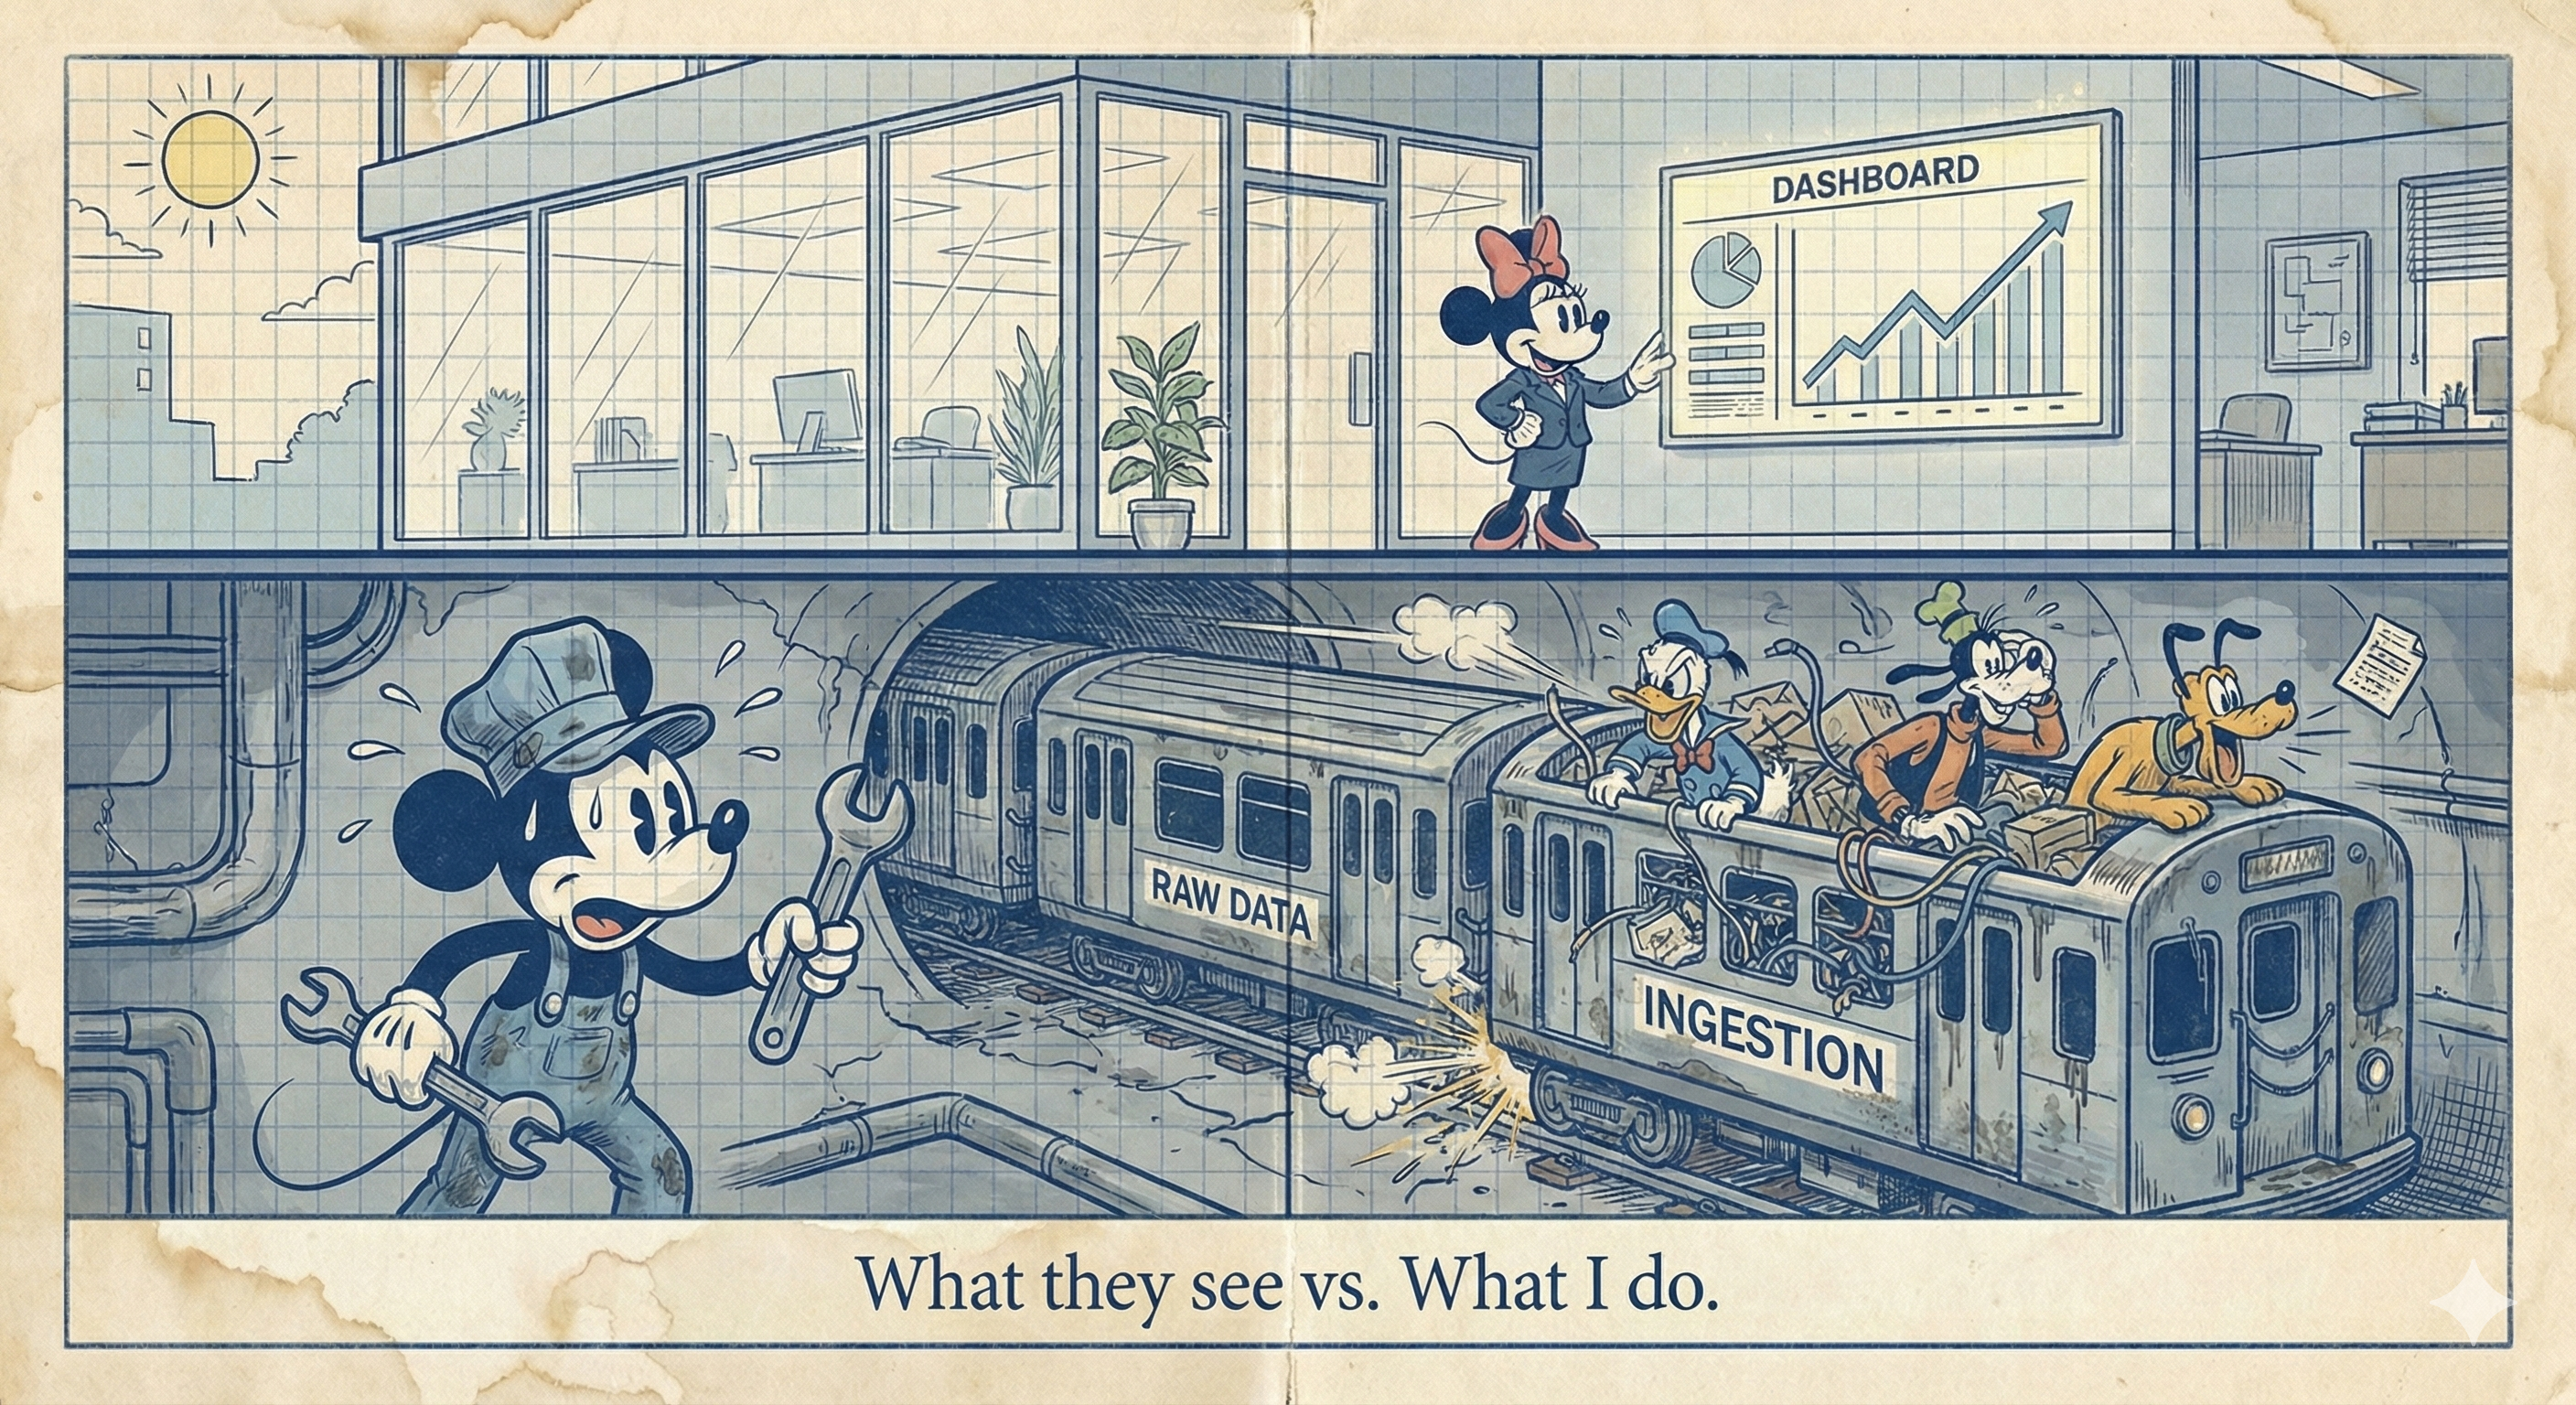 I am a Data Engineer. I build the digital subway.
The Comparison: Why a Subway?
Most people use the term “Data Pipeline,” which sounds like a simple, static pipe. But data isn’t water; it’s more like passengers.
- The Passengers (The Data): Every click, every purchase, and every heart rate monitor reading is a passenger trying to get somewhere.
- The Stations (The Databases): This is where data starts its journey (Source) or ends it (The Data Warehouse).
- The Schedule (The Orchestration): The trains must run on time. If the “Sales Data” train is late, the “Revenue Report” station remains empty.
The Challenges: When the Subway Breaks
Building a subway in a “Digital City” is a constant battle against chaos. Here are three real-world challenges I face, explained through the eyes of a Subway Architect.
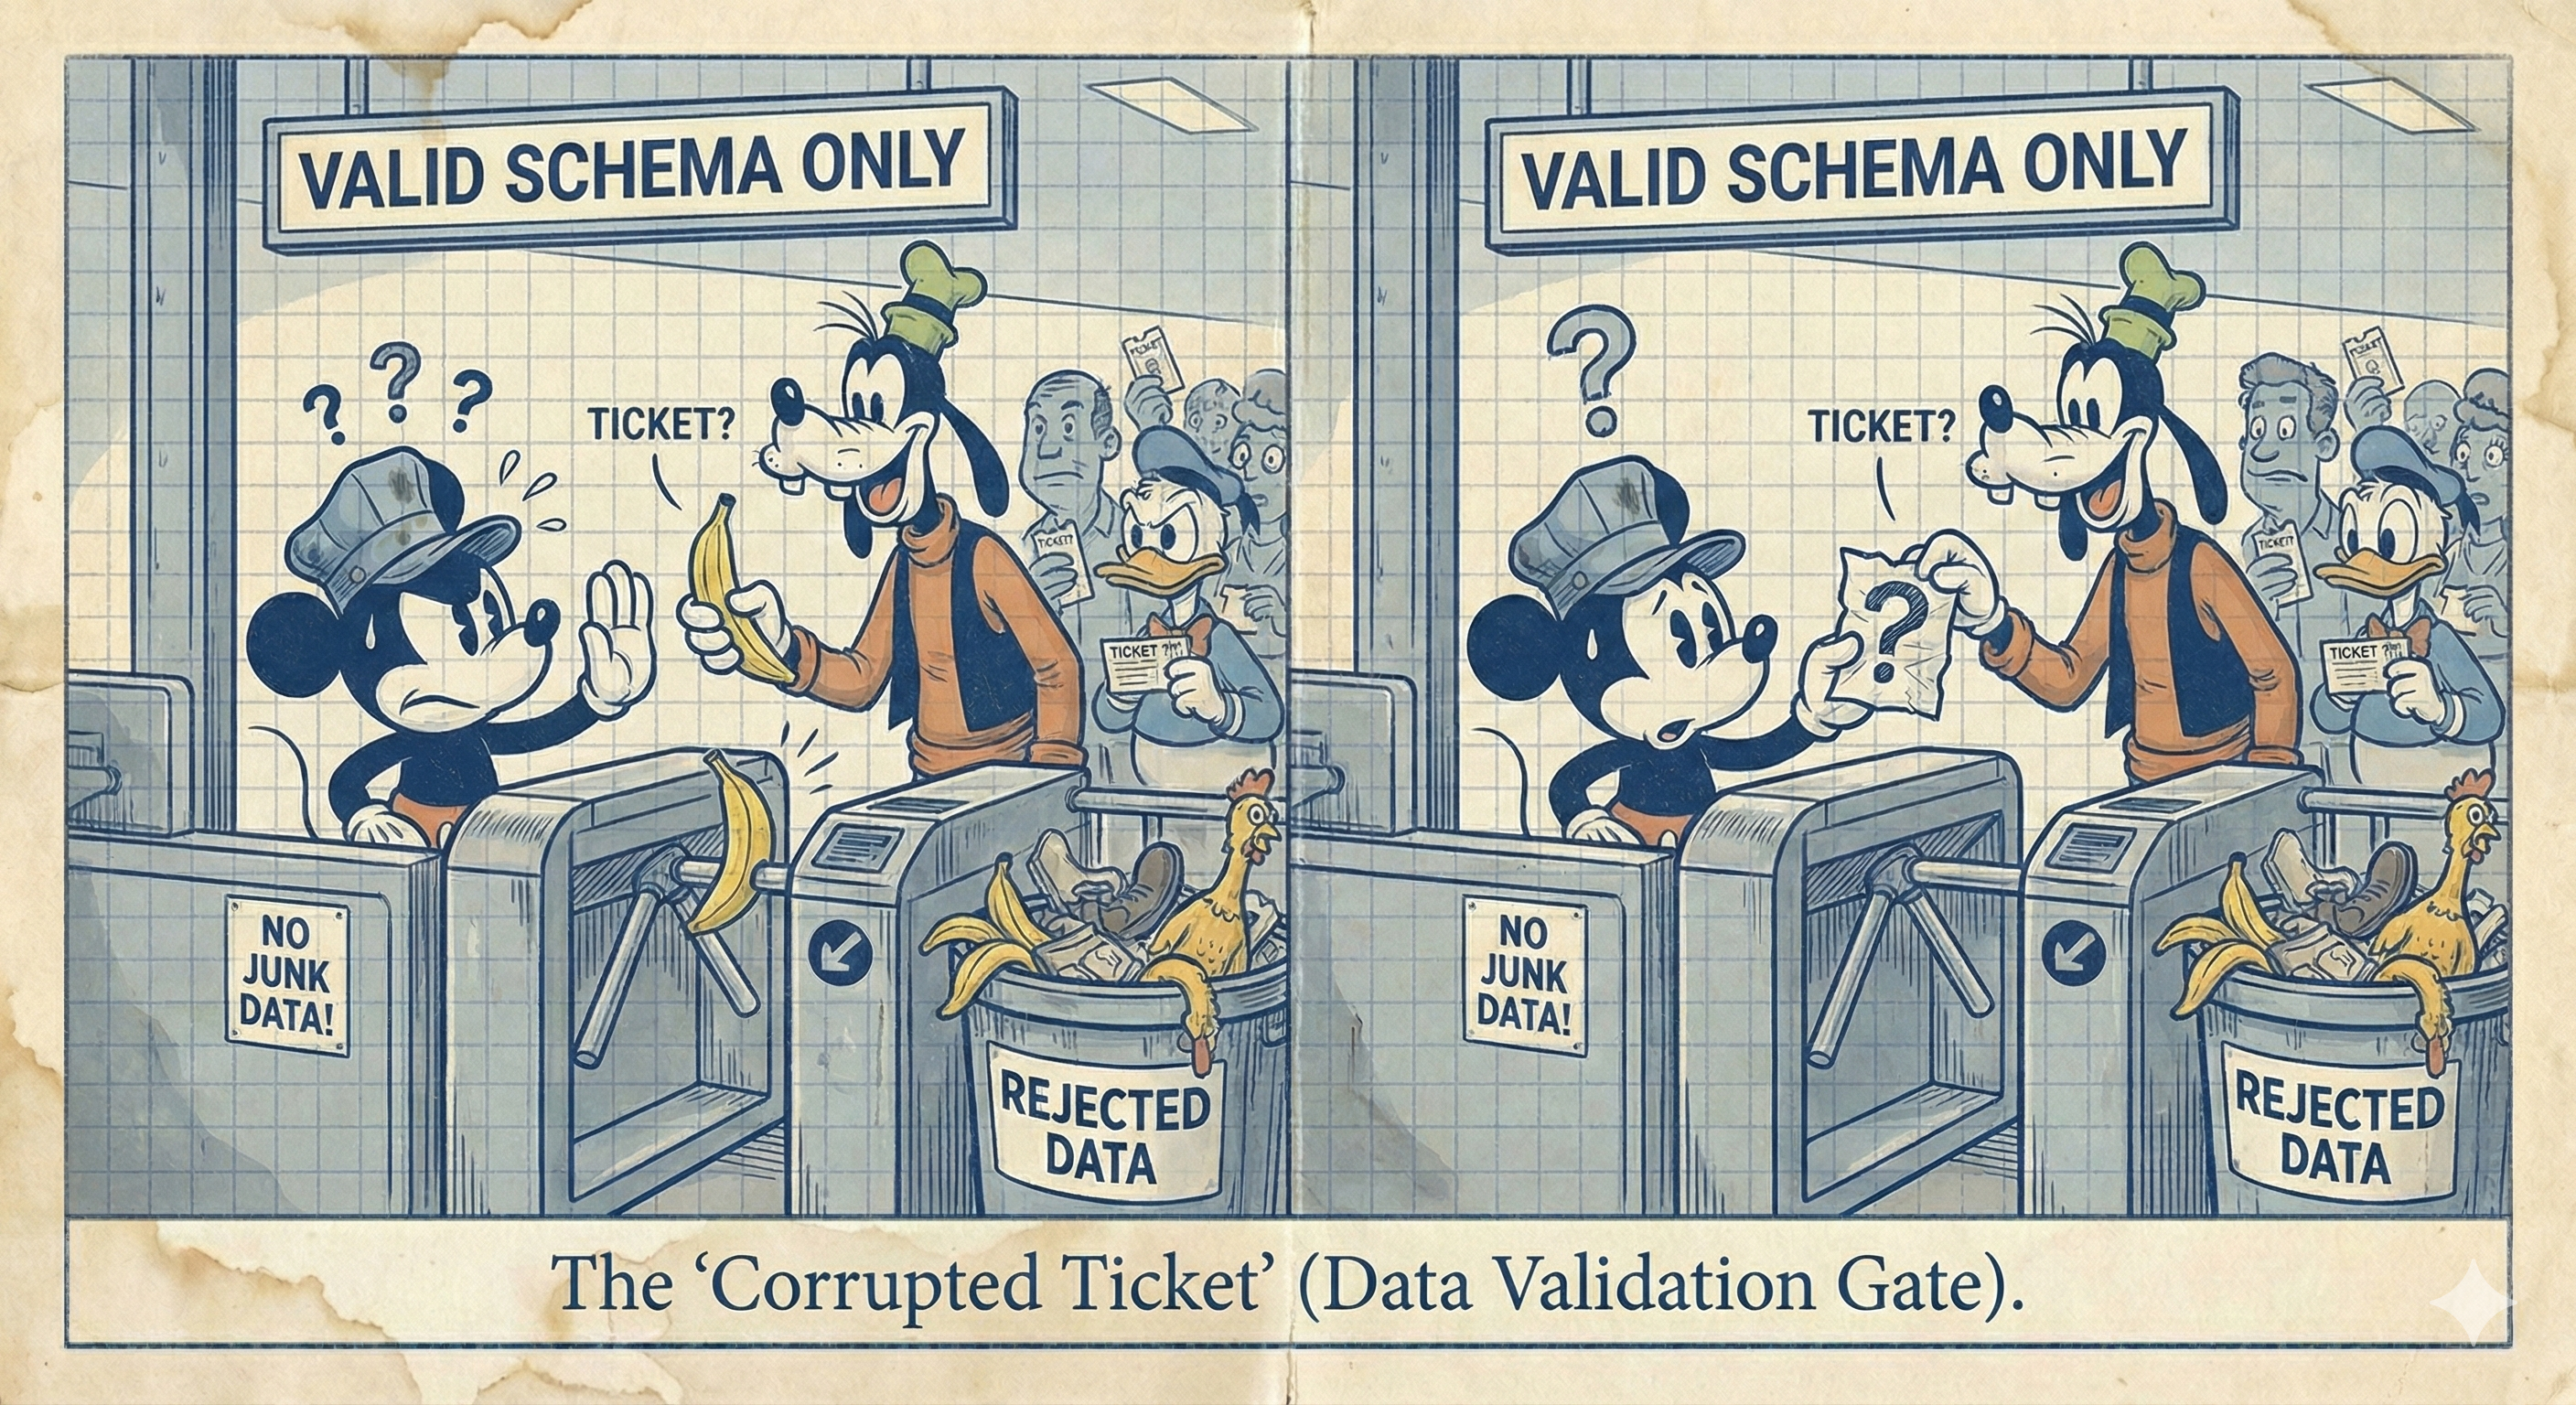
1. The “Corrupted Ticket” (Data Validation)
The Story: Imagine a passenger tries to enter the station, but their ticket is written in a language the machine doesn’t understand, or it says they are 500 years old.
- The Reality: An e-commerce app sends a “Price” field as “$19.99” (a string) instead of
19.99(a number). - The Fix: We build Data Quality Gates at the turnstiles to catch these errors before they enter the tunnel.
2. The “Ghost Train” (System Latency)
The Story: The schedule says a train arrives every 5 minutes. But suddenly, the tunnel is blocked, and no trains arrive for an hour. When the blockage clears, 12 trains all try to enter the station at the exact same time.
- The Reality: A source API goes down for three hours. When it comes back online, it dumps three hours’ worth of data into the system at once.
- The Fix: We use Message Queues (like Kafka)—think of these as massive platform waiting areas that hold passengers safely until the next train is ready.
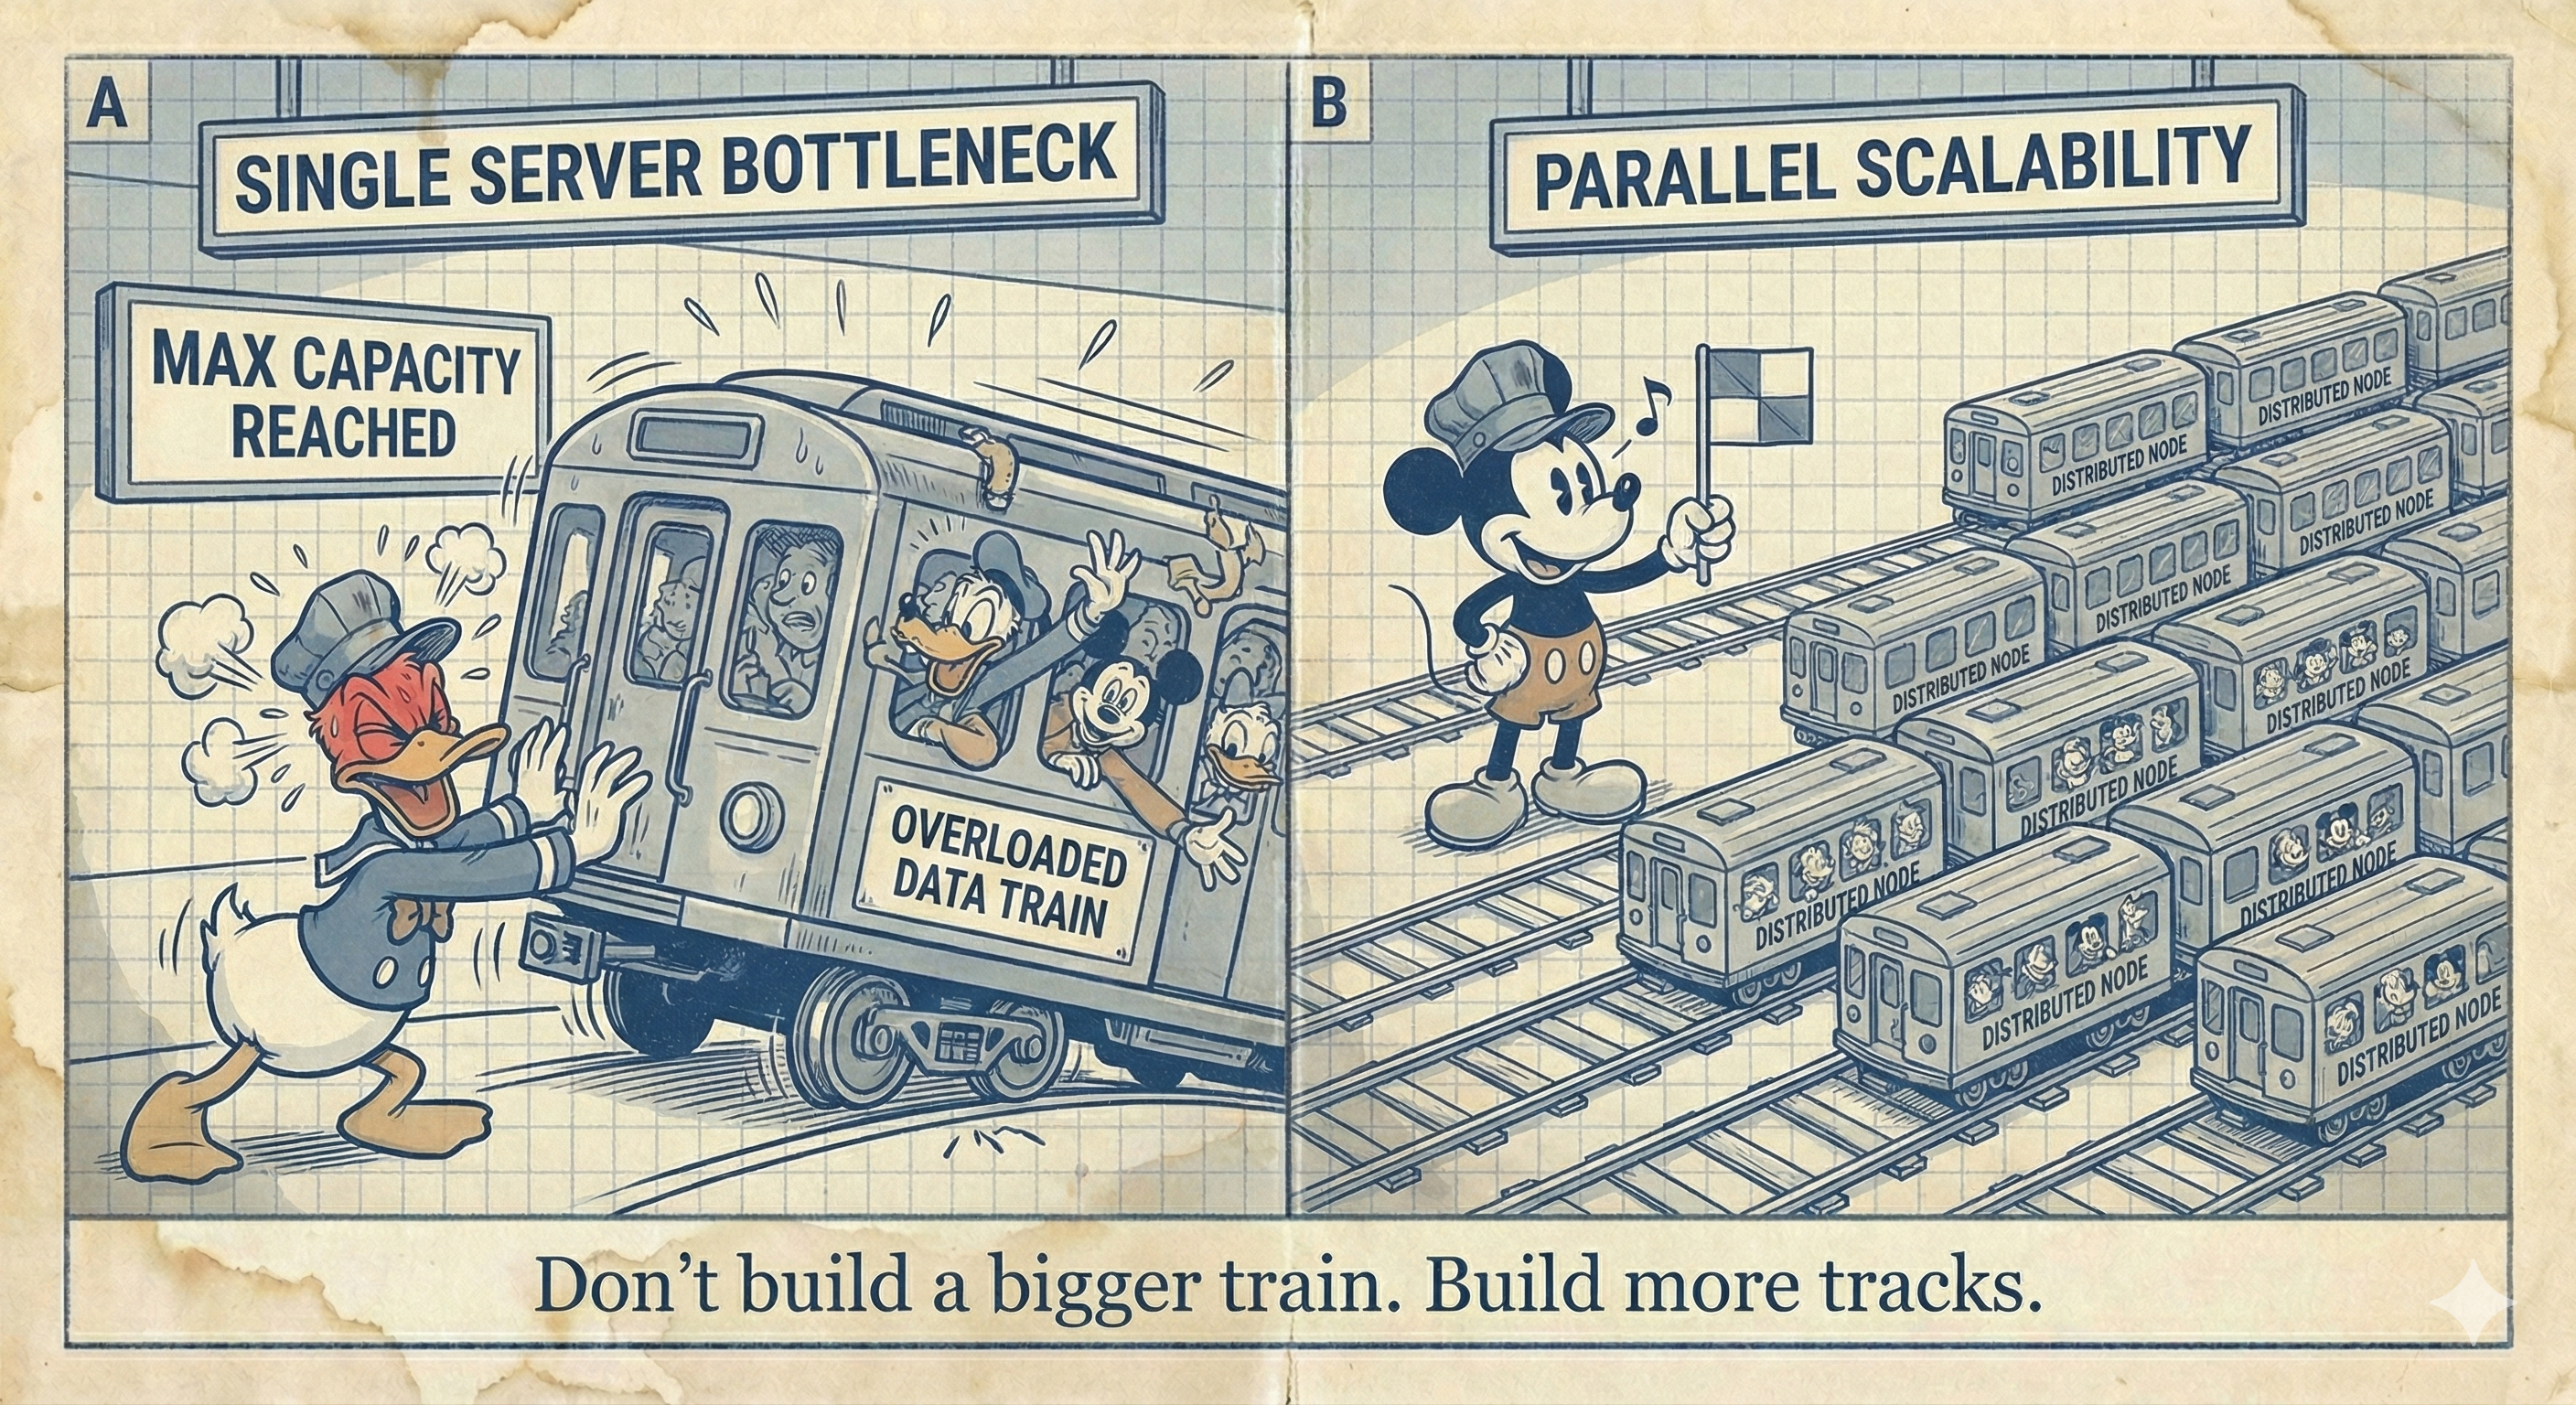
3. The “Expanding City” (Scalability)
The Story: I built a subway for a small town of 10,000 people. Overnight, the town becomes a megacity of 10 million.
- The Reality: Your company launches a viral marketing campaign. Instead of 100 rows of data per second, you are now receiving 100,000.
- The Fix: We build Parallel Tracks (Distributed Computing). We use tools like Spark or Snowflake to break the data into 1,000 small pieces and move them all at the same time on 1,000 different “trains.”
Why I Do It
Being a Data Engineer means working in the dark so others can stay in the light. It’s about building systems that are reliable, scalable, and invisible.
Next time you see a perfect chart or a smart AI recommendation, take a second to think about the “Subway” that brought that data to the surface.